Nightingale’s Rose Diagram
Also called: Polar area diagram, Coxcomb
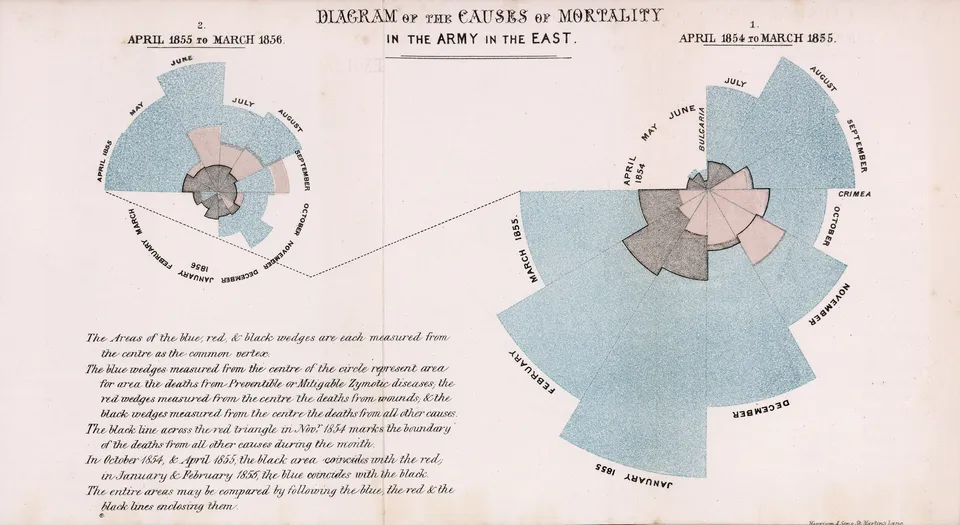
Nightingale drew circular graphs (the “rose diagrams”) dividing the deaths of soldiers in the Crimean War by cause, showing at a glance that most had died of preventable disease.
Florence Nightingale · Public domain · Source
Back from the war, Nightingale took up statistics as her weapon for reforming army health. With the statistician William Farr she gathered the records of Scutari and the Crimea, and in 1858 published a report on the army’s health. In it, circular graphs showed the soldiers who died each month, divided by area into deaths from wounds, from preventable disease, and from other causes.
Anyone could see that the blue wedges — deaths from preventable disease — dwarfed the deaths in battle. The “rose diagram” is counted among the early examples of turning numbers into pictures to change policy. That year Nightingale became the first woman member of the Royal Statistical Society.